Secret Cow Visualization
Moo
disaster_data_new = final_data %>%
  ungroup(location) %>%
  group_by(year) %>%
  dplyr::select(year, n_total) %>%
  distinct(year, n_total) %>%
  drop_na()

cow_data = read_csv("./data/cow_data.csv")  %>%
  janitor::clean_names() %>%
  dplyr::select(year, cattle_calf_crop_measured_in_head_b_value_b) %>%
  rename(total_cows_usa = cattle_calf_crop_measured_in_head_b_value_b) %>%
  inner_join(disaster_data_new, by = "year") %>%
  drop_na()
library(grid)
dis_plot = cow_data %>%
ggplot(aes(x = year, y = n_total)) +
geom_line(alpha = 0.2, color="blue")+
geom_smooth(se = FALSE, color="blue")+
labs(title = "ARE THE COWS TO BLAME: A Visualization of Disaster and Cow Trends",
x = "Year",
y = "Total Annual Disasters")
cow_plot = cow_data %>%
ggplot(aes(x = year, y = total_cows_usa)) +
geom_line(alpha = 0.2, color="red")+
geom_smooth(se = FALSE, color="red")+
labs(x = "Year",
y = "Total Cows")grid.newpage()
grid.draw(rbind(ggplotGrob(dis_plot), ggplotGrob(cow_plot), size = "last"))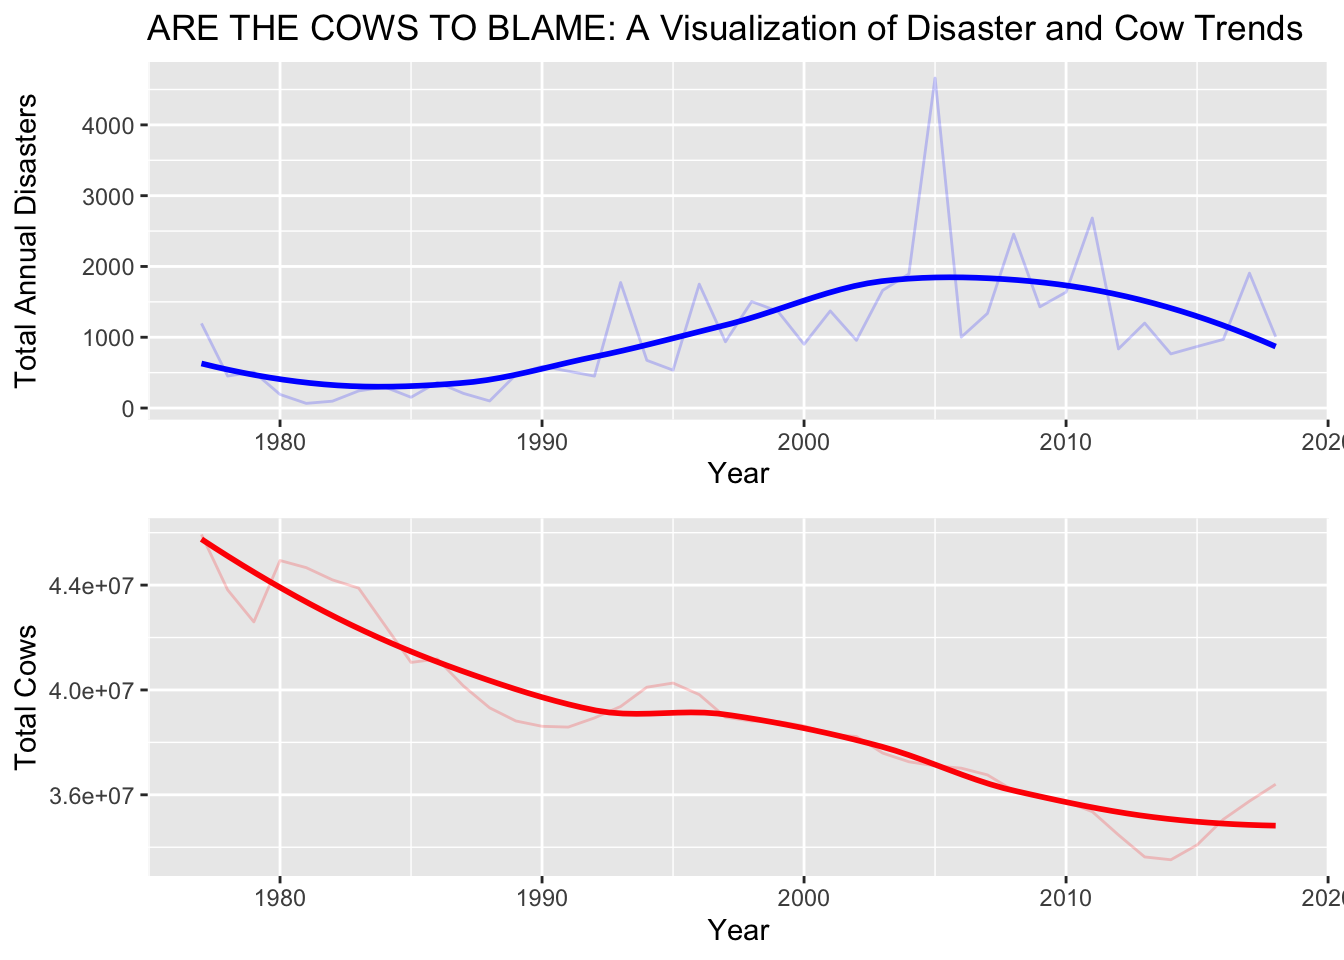
Based on these plots, the cows are not at fault. The search contimoos.