Modeling: Poisson vs Negative Binomial Regression
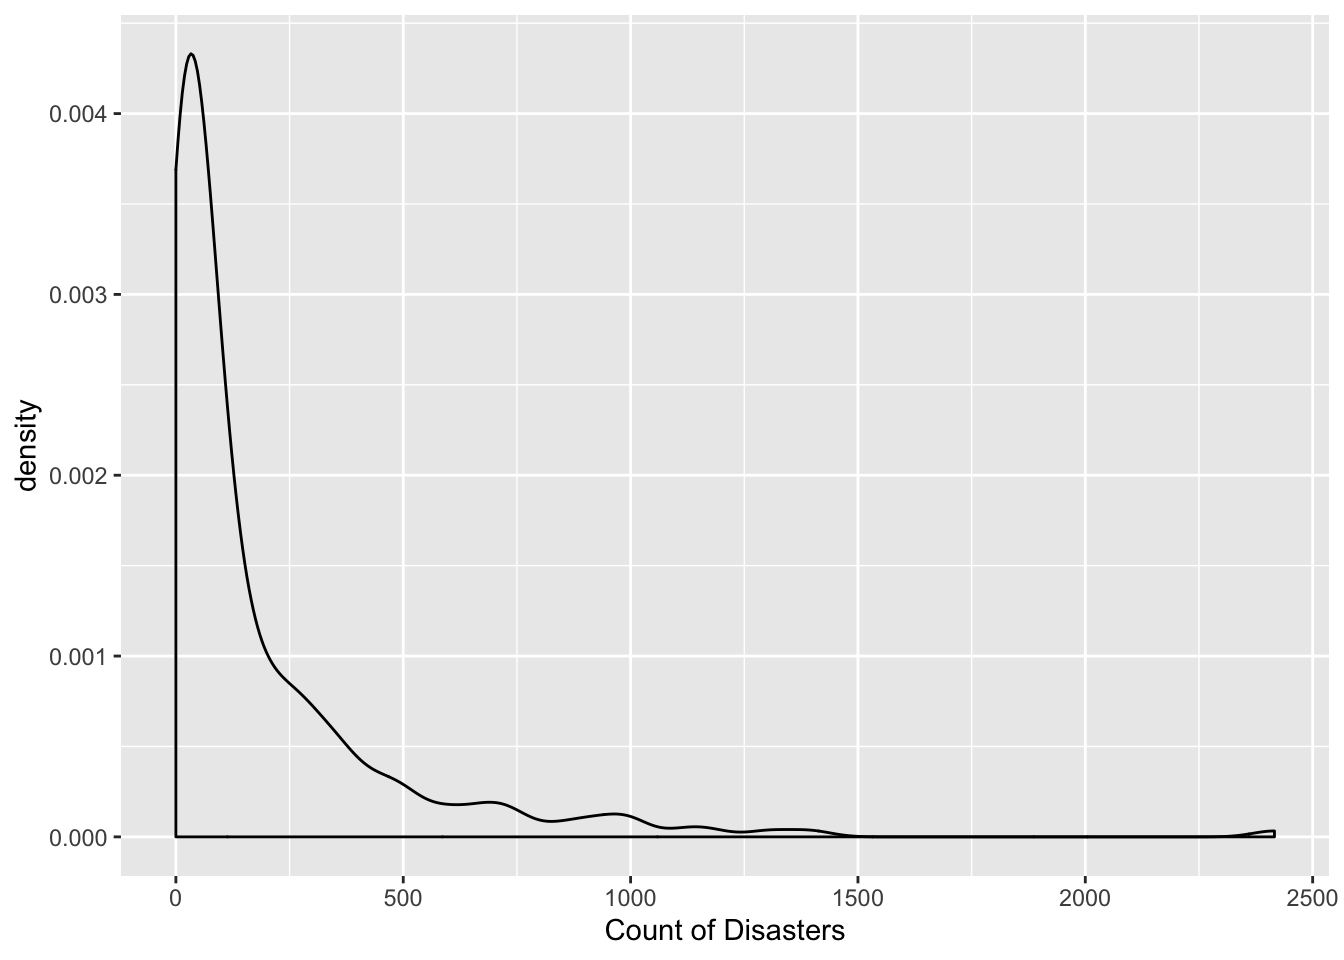
After inspecting the summary visualizations and plotting the distribution of the data, we decided to run a Poisson regression model to formally test the hypothesis that the count of natural disasters by US region is increasing between 1953-2018. The distribution illustrating the number of disasters per year indicated that our data was highly right skewed. Poisson modeling is appropriate because (1) we are modeling count data and (2) our data is right skewed with positive values only. Motivated by our exploratory visualizations, we also decided it was necessary to control for mean temperature and precipitation.
There are two main ways to model this data:
Poisson Regression: assumes mean = variance
Negative Binomial Regression: accounts for overdispersion where variance > mean
Variables of Interest
First, let’s consider our variables of interest.
Count of Disasters: The number of disasters by year and region.
Year: Ranges from 1953 to 2018.
Region: The US regions categorized by Midwest (reference category), Northeast, Southwest, and West. These regions were defined by the World Atlas definitions.
Average Temperature: The average temperature in degrees Fahrenheit by region.
Precipitation: The total amount of rainfall in inches by region.
Cross Validation
After testing various models with just Poisson, we fit a final model that takes the form:
\[ log(\lambda Count \ of \ Disasters) = \beta_0 + \beta_1 Year + \beta_2 Region + \beta_3 Average \ temp + \beta_4 Precipitation \]
We tested several interaction terms, but none were significant enough to include in the final model. Now we can use cross validation to test whether Poisson or Negative Binomial Regression fits our data best.
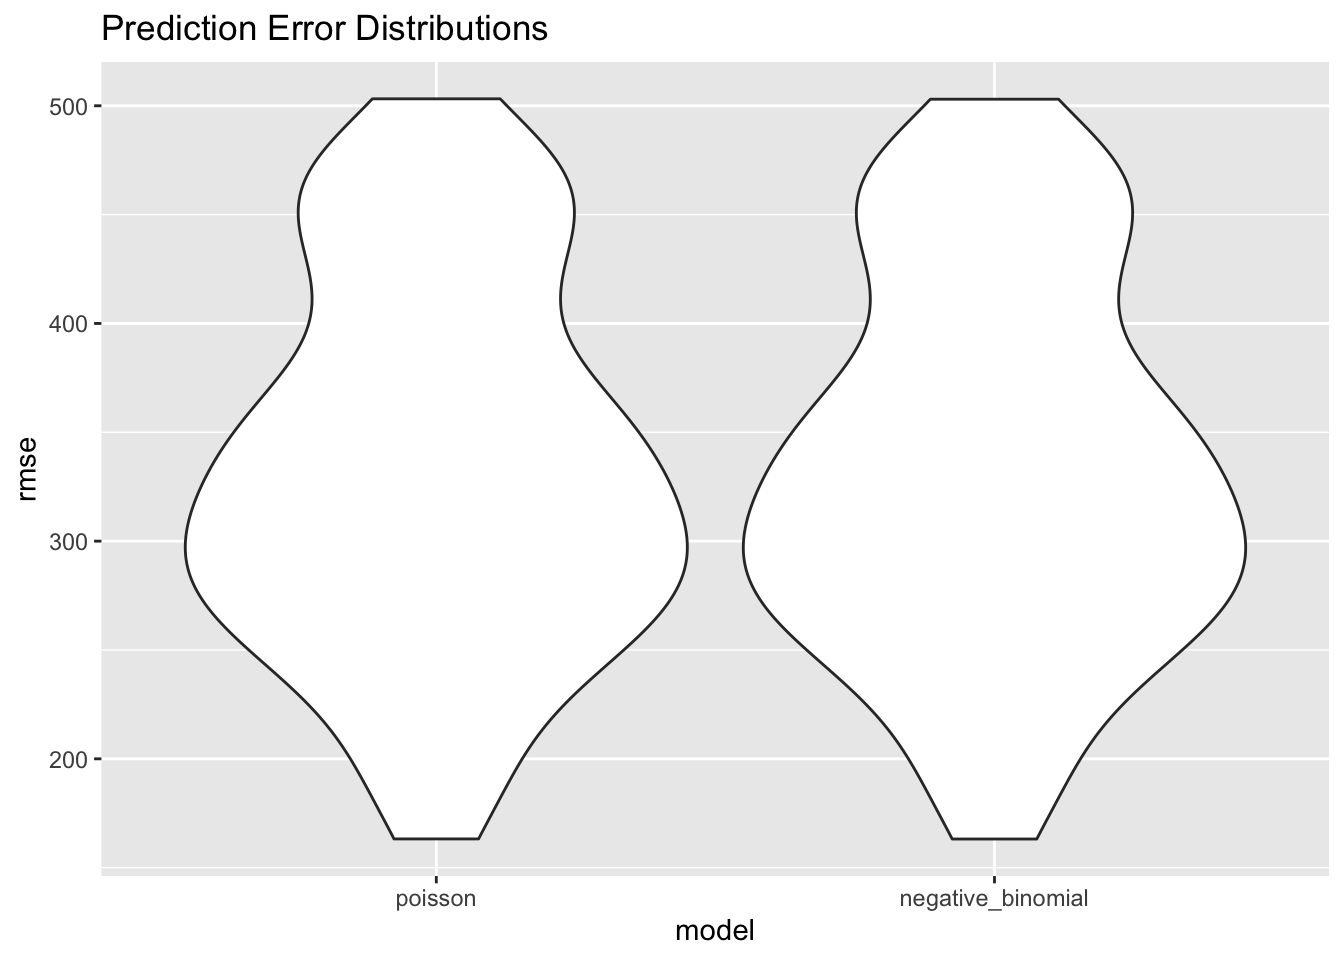
Reviewing the distributions of residual mean squared errors above, it is hard to distinguish between our two models. Instead, we can compare AICs and use the model with the lowest AIC.
Poisson Model
Negative Binomial Model
Using AIC as a measure for Goodness of Fit, we choose the Poisson Model.
poisson_output = poisson_model %>%
  broom::tidy() %>%
  dplyr::select(term, estimate, p.value) %>%
  mutate(exp(estimate))

poisson_output %>%
  knitr::kable(digits = 3)
| (Intercept) |
-61.792 |
0.000 |
0.000 |
| year |
0.033 |
0.000 |
1.034 |
| regionnortheast |
-1.392 |
0.000 |
0.249 |
| regionsoutheast |
-0.621 |
0.000 |
0.538 |
| regionwest |
-0.776 |
0.000 |
0.460 |
| ave_temp |
-0.008 |
0.014 |
0.992 |
| sum_precip |
0.002 |
0.000 |
1.002 |
Main Findings
Fitting the Poisson regression model, the results were significant at the 5% level of significance. After adjusting for region in the US, average temperature, and precipitation, we found that for every increase in year, the expected count of natural disasters increases by 1.034 times. This supported our hypothesis that the count of natural disasters increased from 1953 to 2018.
As for geographic regions, we found that the Northeast, Southeast, and West regions have significantly less expected counts of natural disasters compared to the Midwest controlling for other variables in the model. For example, the Northeast has 0.248 times, or about 75% less, expected disasters compared to the Midwest.
The results for our climate indicators were unexpected. The average temperature is negatively associated while the total precipitation is positively associated with count of natural disasters. As temperature increases by 1-degree F, the expected count of natural disasters decreases by about 1% or 0.992 times controlling for other variables in the model. As total precipitation increases by 1-inch, the expected count of natural disasters increases by 1.002 times.
Reflecting on this, we can conclude that further analysis should be done on different types of disasters. For example, temperature may be positively associated with counts of fires or droughts. But these disasters may be negatively associated with precipitation.